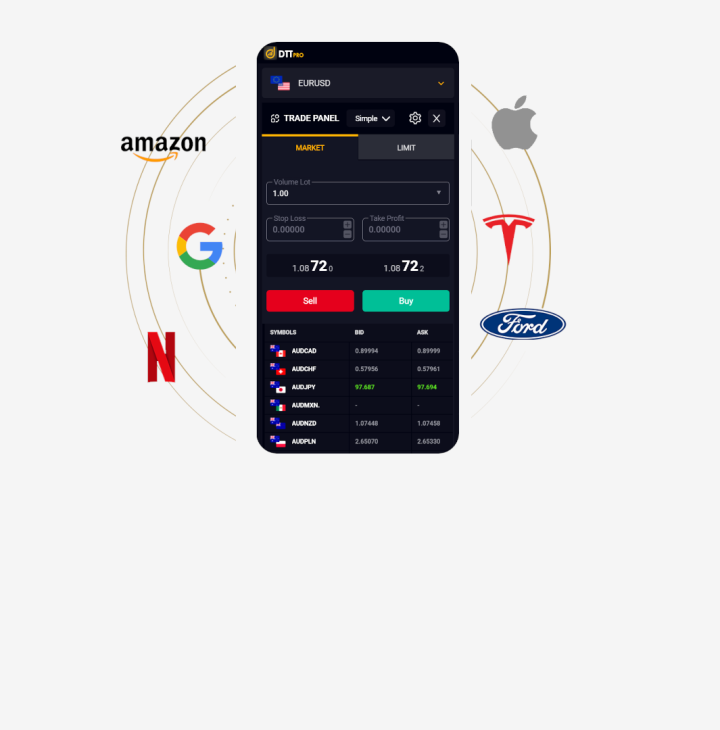
Trade 100,000+ financial instruments with Global DTT
Take your trading experience to the next level with a globally trusted broker.
- 8 Worldwide Offices
- 30+ Global Awards
- 24/7 Customer Support
Global DTT is a leader in the global financial services and fintech landscape, delivering cutting-edge solutions and more than 100,000 financial products that empower traders, institutions, and fintech startups worldwide. With a strong global and strategic presence, Global DTT combines decades of market expertise with forward-thinking innovation.


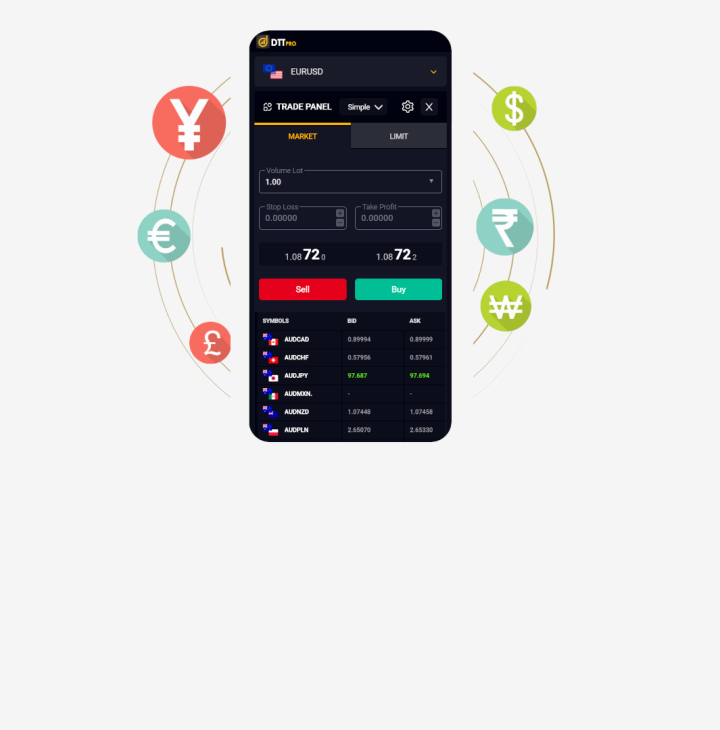
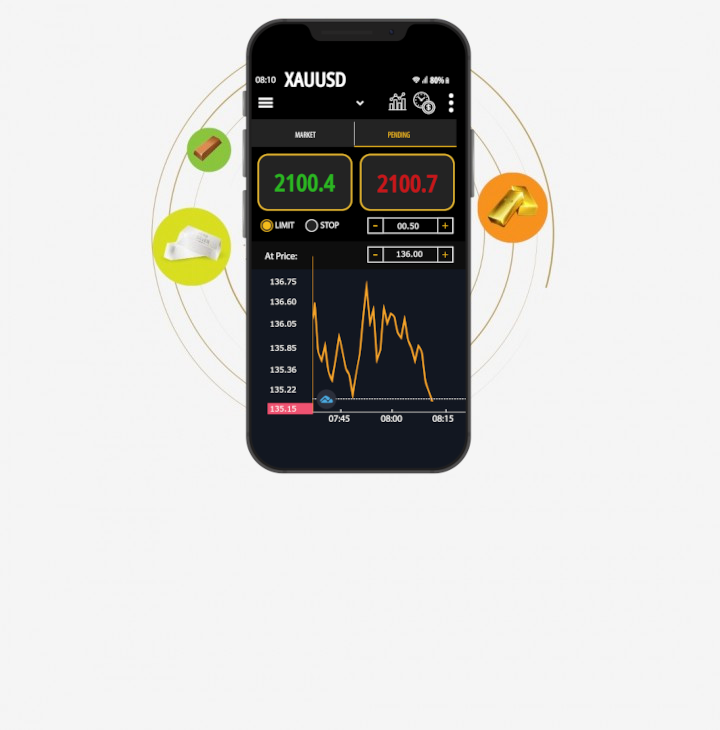
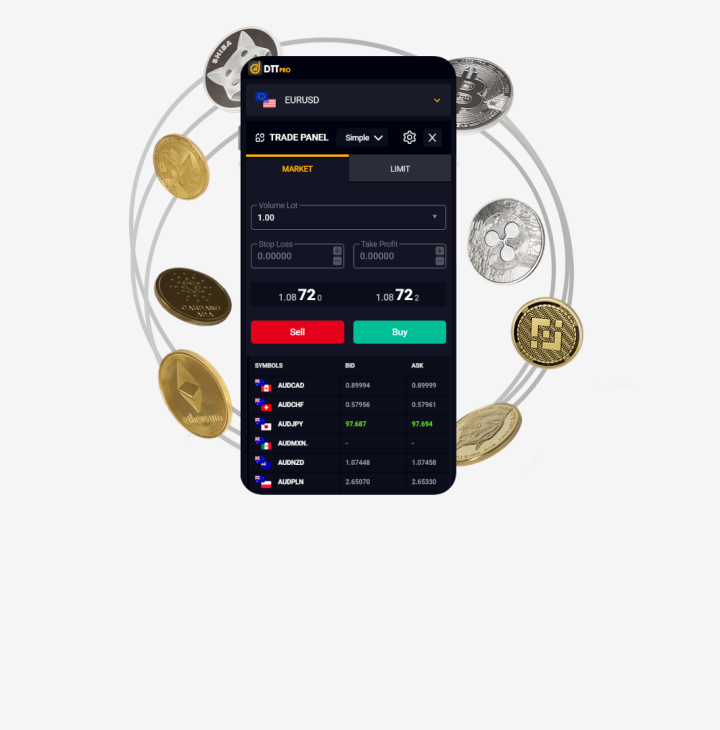
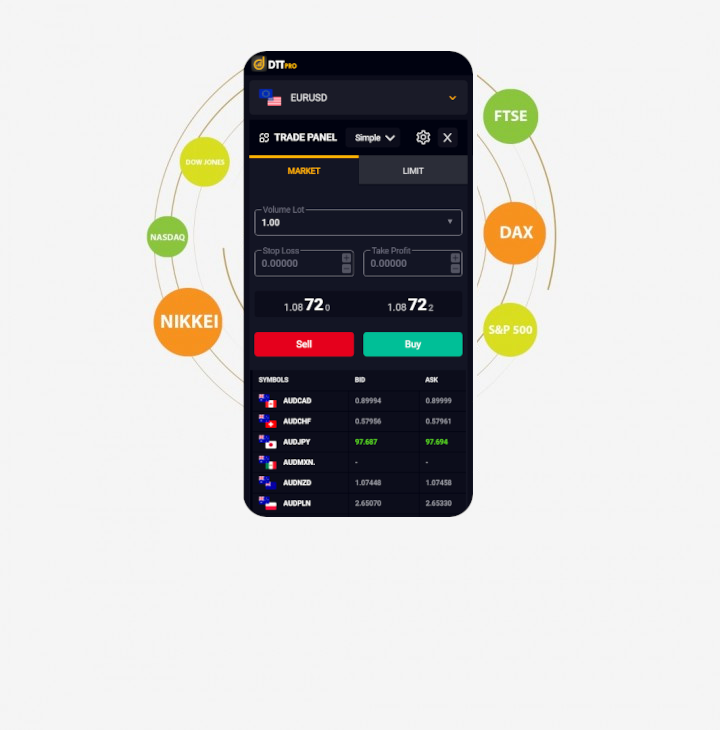
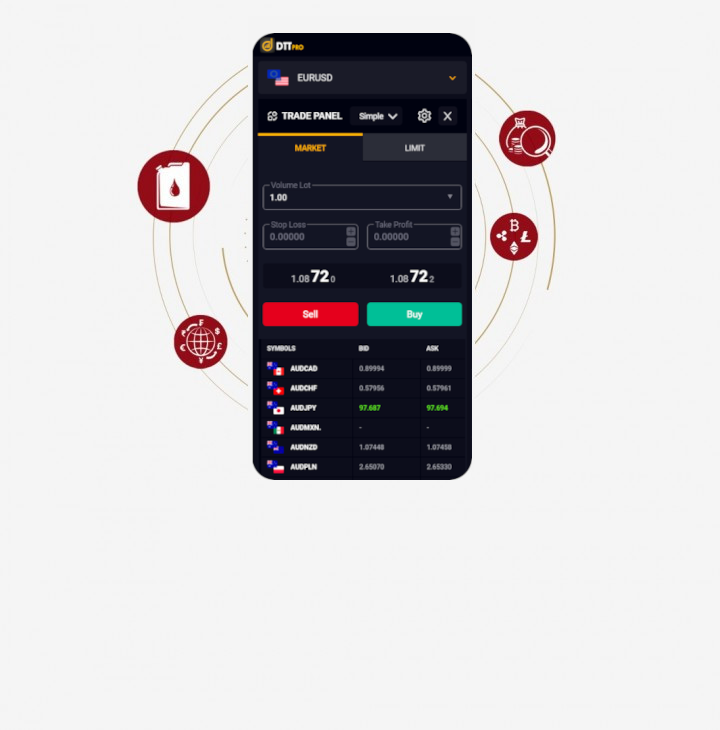
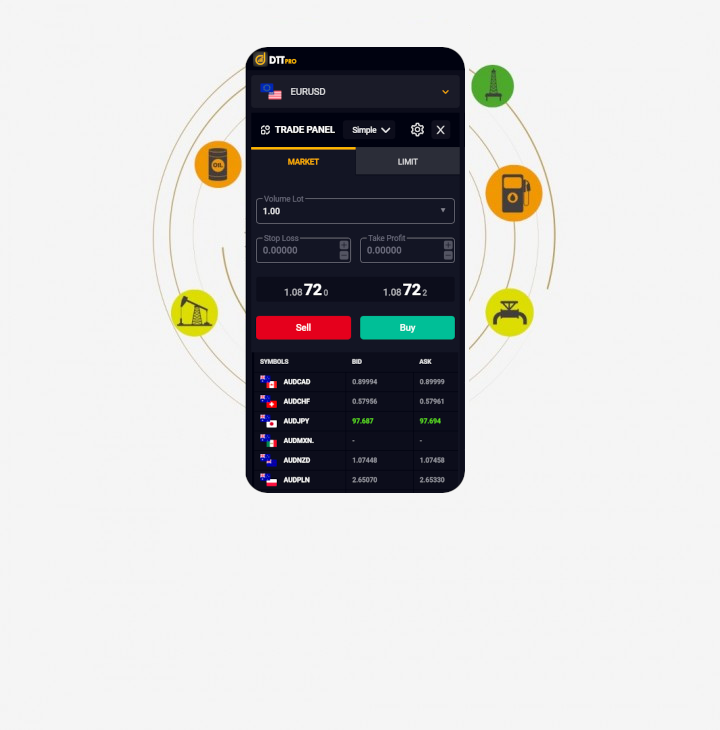
Trade 100,000+ financial products with a globally regulated broker.


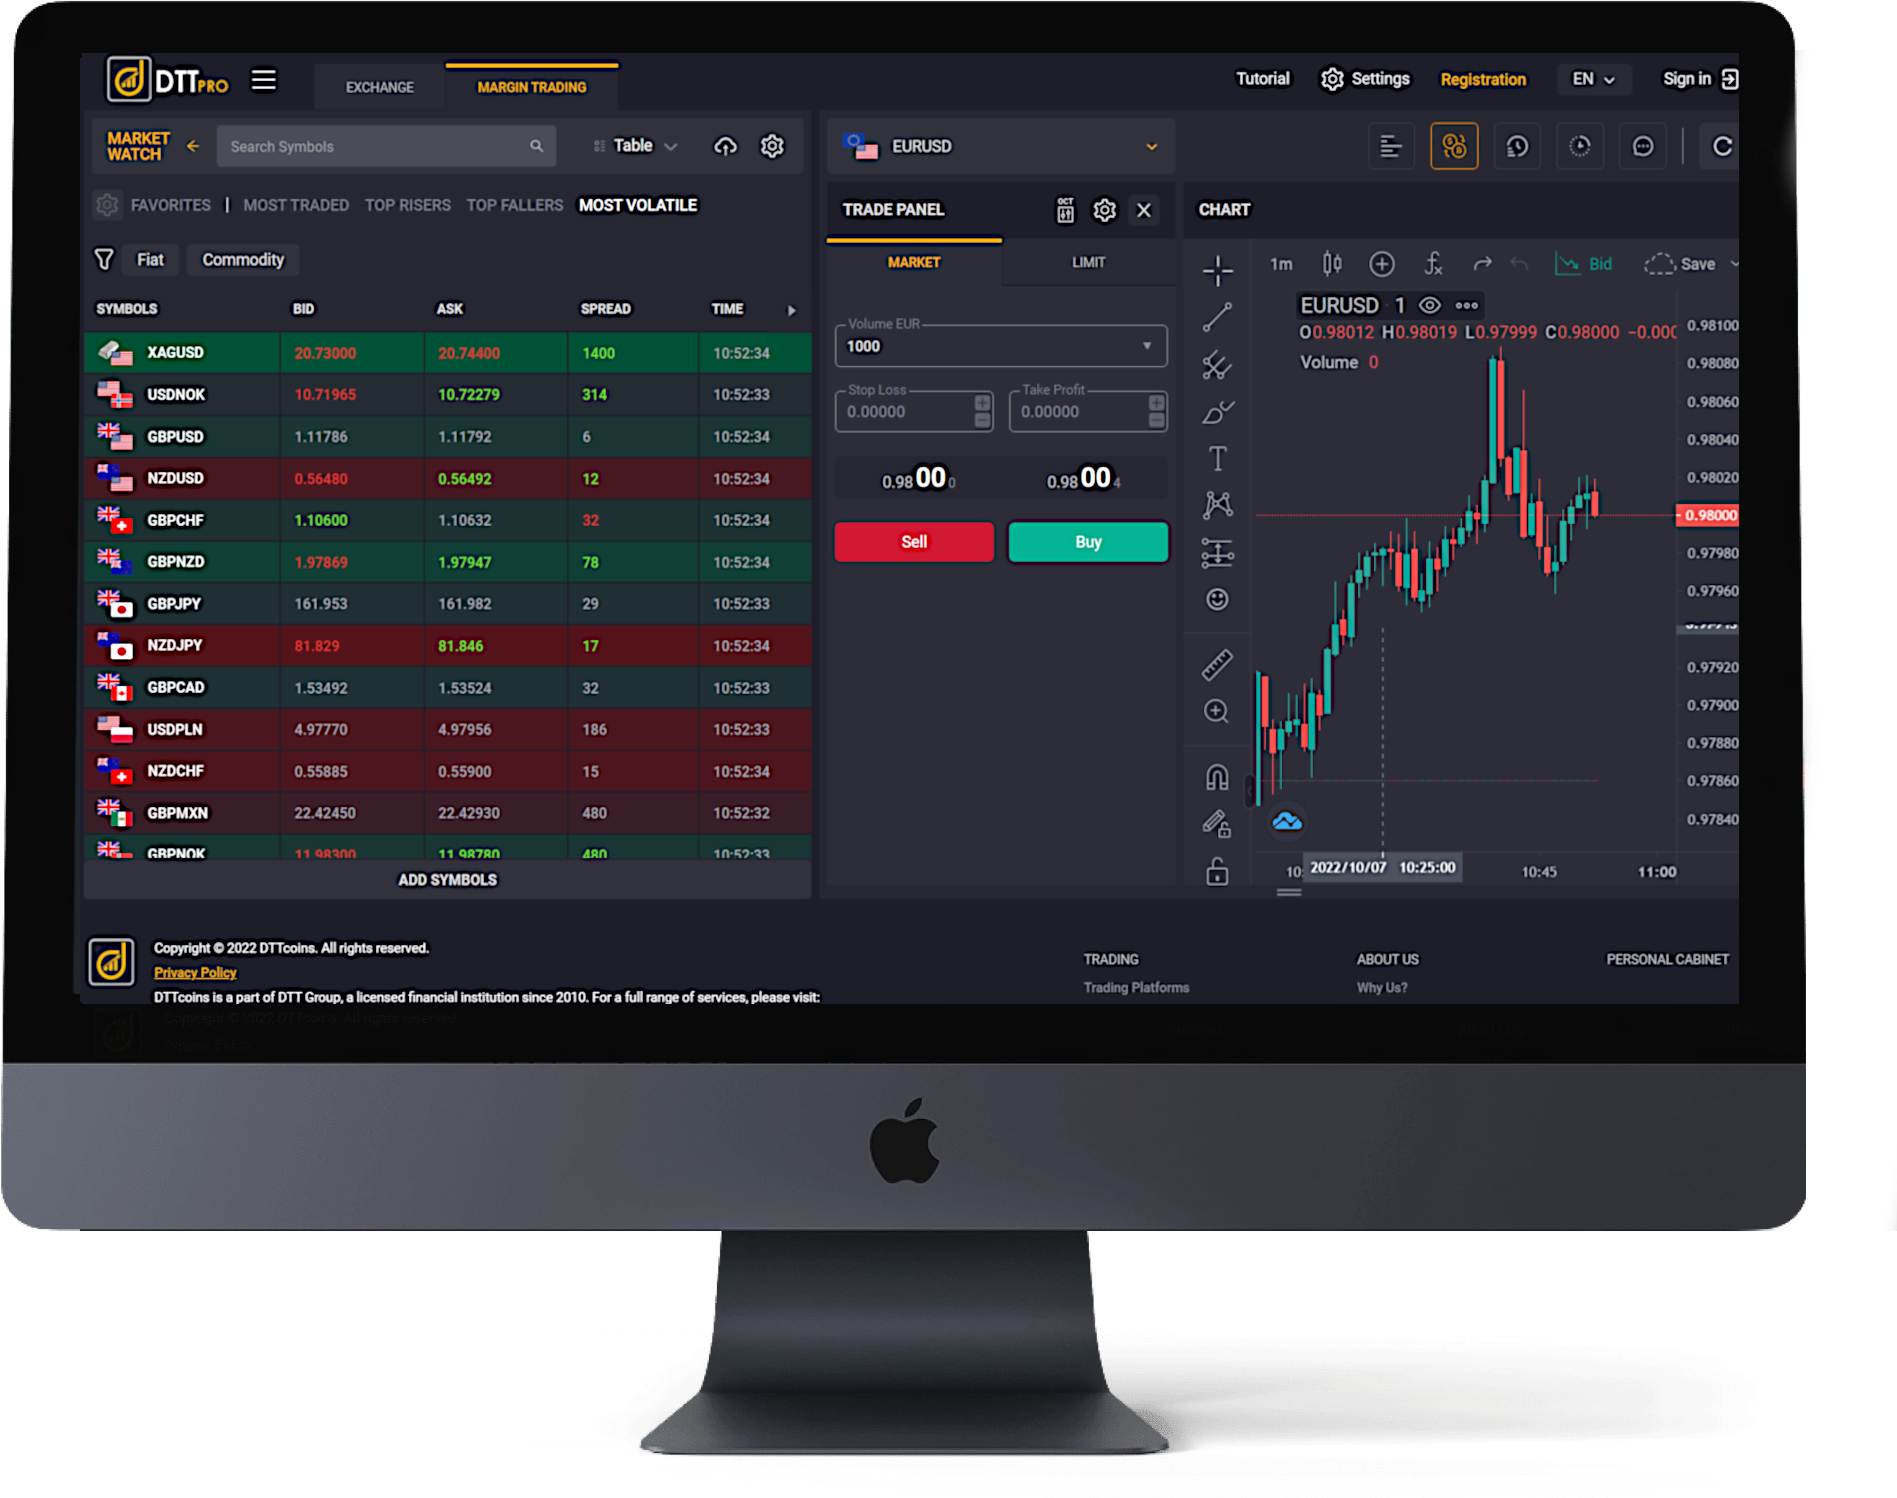
With institutional grade execution, user-friendly interfaces, intelligent tools & indicators, our offered platforms provide the ultimate experience while meeting the most demanding requirements.


Exclusive for Global DTT clients:
- Withdraw instantly to your Global DTT Visa card
- Use your card at any point of sale or ATM


LEARN FIRST, INVEST LATER.
Sign up for our free and live weekly webinars with our leading financial experts.
Available for beginners and professional traders
in English, Arabic, and Spanish.
Risk Warning: CFDs and Forex are leveraged products which carry a high degree of risk and are not suited for everyone. Losses can exceed your investment. Please ensure you fully understand all the risks involved, seeking independent advice if necessary prior to entering into such transactions.
DTT VAN LTD is authorized and regulated by the Vanuatu Financial Services Commission at the Republic of Vanuatu, Register No: 40169.
Direct TT for Financial Consulting, a Financial Services Company authorised and regulated in the
UAE by the SCA, License No: 20200000042.